
Prawn Charts
Prawn Charts is a Prawn graphing library to create linear or log line charts in Prawn with no dependencies other than Prawn.
Examples
Clone the respository and run the following script to generate a PDF file with a log graph on your Desktop:
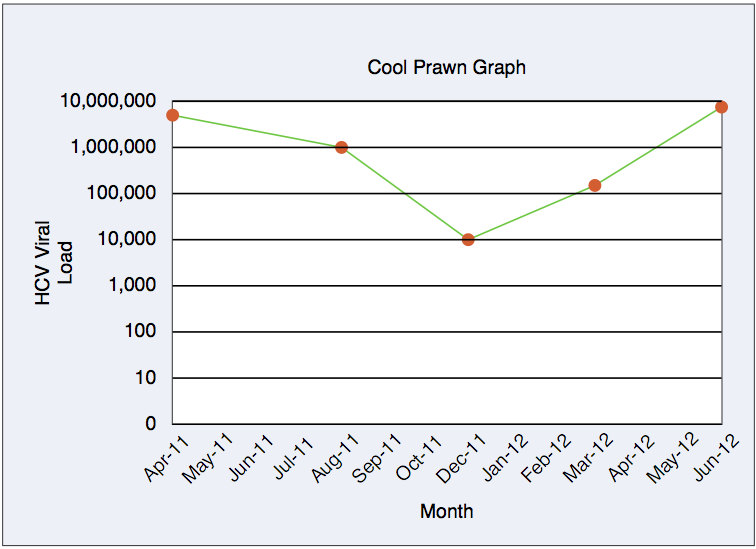
$ ruby lib/examples/log_example.rb
This script will generate a PDF file of a log graph that is only 6KB.
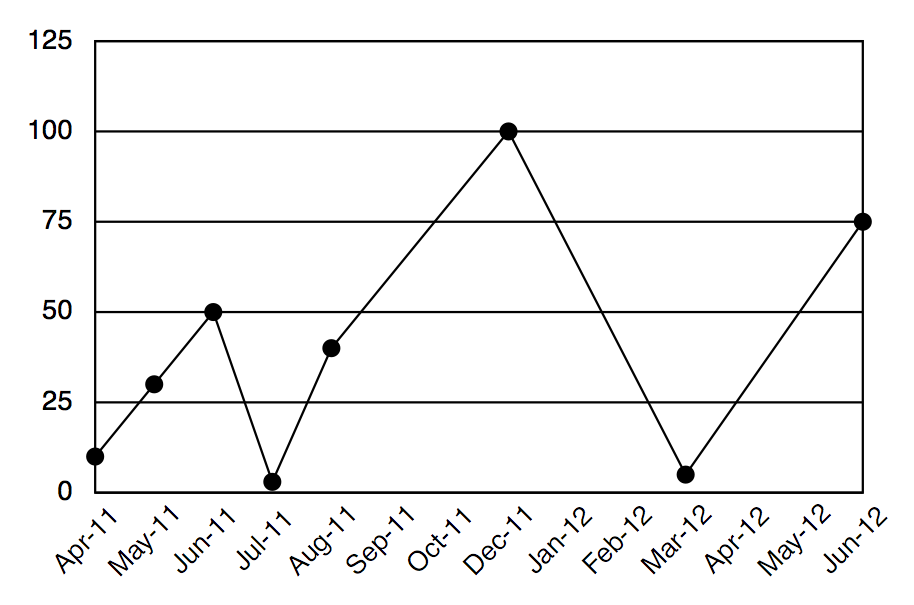
Prawn Charts can also be used to generate linear graphs. This graph does not leverage built in features (i.e. graph title, y label, x label) and demonstrates that Prawn Charts is easily customizable.
Code Organization
The DataCollectors (located in lib/data_collectors) are responsible for manipulating input data in a format suitable for the PrawnChartRenderer. The PrawnChartRenderer module should be mixed in to Prawn::Document, so the renderer methods can be called directly on the Prawn::Document object.
This example code shows how to use the PdfDataCollector to get formatted data that can be passed to the draw_chart() and draw_dots() methods:
Prawn::Document.extensions << PrawnChartRenderer

pdf = Prawn::Document.new
pdf.bounding_box([50, pdf.cursor], :width => graph_width_pdf, :height => graph_height_pdf) do
  pdf.stroke_bounds

  pdf_data = PdfDataCollector.new(scale, input_data, graph_width_pdf, graph_height_pdf, y_labels).collect
  pdf.draw_chart(pdf_data)
  pdf.draw_dots(pdf_data, dot_radius)
end
There are separate methods to draw_chart(), draw_dots(), draw_labels(), draw_horizontal_lines(), and draw titles, so the charts can be customized.